Return on Mission: A Framework to Measure Success at Philanthropic Organizations

As a nonprofit organization, which factor do you believe best showcases the success of your mission?
- Overhead to program expense ratio
- Having money left over to reinvest at the end of the year
- Programmatic statistics related to mission impact
As with many multiple-choice tests, there is only one answer here that makes sense: programmatic statistics related to mission impact. Unfortunately, philanthropies are typically (and problematically) judged by the first two criteria.
As Chuck McLean and Suzanne E. Coffman stated in their 2004 GuideStar article:
“There’s no question that nonprofit organizations have an obligation to manage their finances responsibly. There’s also no question that ratios can be valuable tools for evaluating charitable groups. By themselves, however, these figures can be more misleading than helpful.”
If we continue trying to measure social change by financial criteria alone, we’ll never have full view of the inputs and processes necessary to create lasting impact.
How did we get here?
For years, we’ve used language from for-profit businesses to explain nonprofit organizational activity. However, in an attempt to communicate mission success in borrowed terms, we have made it more difficult to explain the critical connection between financials, fundraising, and mission delivery.
There are undoubtedly for-profit business practices that we in the charity world use every day to the benefit of our employees and missions. However, we shouldn’t rely on for-profit output measures to paint a complete picture of nonprofit success.
For instance, the corporate profit and loss statement isn’t the same as our nonprofit budget to actuals report, and it falls short of providing the information necessary to effectively assess whether we need to course correct throughout the year.
To better understand the shortcomings of for-profit metrics as a true measure of nonprofit success, let’s take a look at how return on investment (ROI) is calculated.
How is ROI calculated?
ROI is a cost/benefit analysis methodology that measures how much money is made or saved for a given investment and is calculated as
ROI = (Gain from Investment – Cost of Investment / Cost of Investment) * 100
A sophisticated ROI calculation considers tangible and intangible items within the “Gain from Investment” part of the equation while the “Cost of Investment” is the straightforward tabulation of pricing.
Tangible items include hard costs, revenue, or new customers gained. Intangible value created includes items such as brand awareness, customer satisfaction, and operational excellence.
This formula permeates many nonprofit board meetings as a means of calculating the value of an investment. And while this measure works to an extent for nonprofits to understand the direct financial benefits of an investment, on its own, it fails to connect those metrics—which are the business of charitable work—to the social impact of that same work.
I’ve personally had to define the word “nonprofit” to a fellow board member when he wanted to discuss the ROI on a free program we were implementing for individuals who couldn’t afford a specific treatment. We found common ground, but it took a while for him to get out of his for-profit mindset and think in terms of mission outcomes instead.
For years, I’ve advocated for one key change that would take a for-profit success measurement framework — ROI — a step further to provide a truly mission-focused measurement of nonprofit impact, return on mission® (ROM).
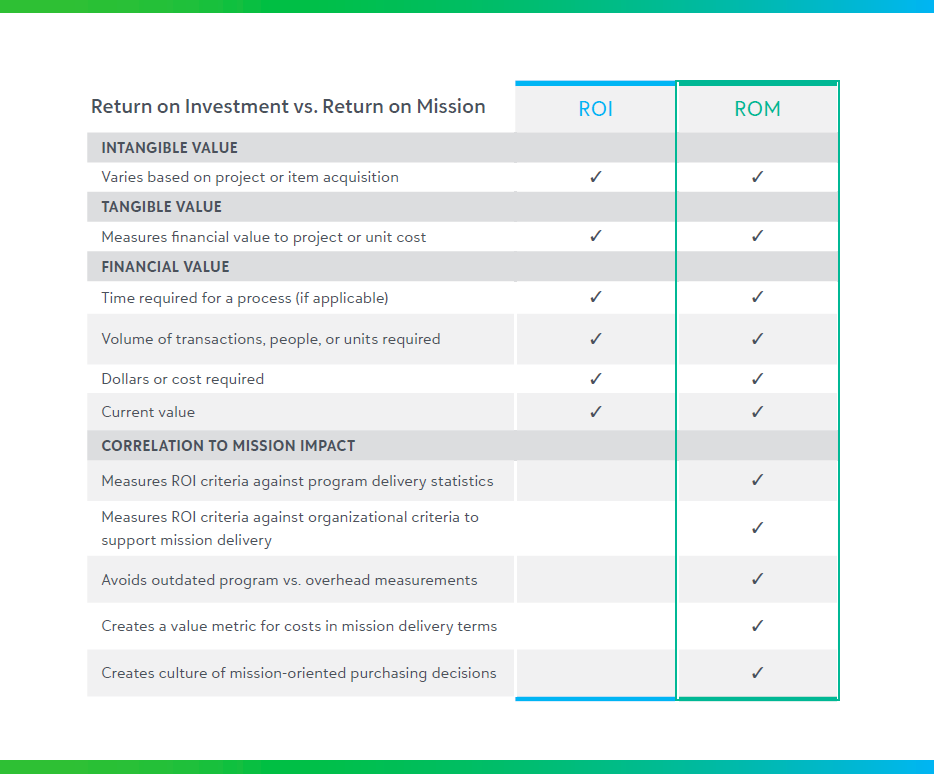
So, what are the differences between ROI and ROM? They share much of the same DNA, but the final step to correlate the formula outcome to mission impact is what creates ROM.
How do we transition from return on investment to return on mission®?
As I explained in my previous npENGAGE article about nonprofit overhead:
The concept of [ROM] is that the real measure of a charity’s success is not in how [high] the return is on an ‘investment’ (e.g., a grant, major gift, etc.) but rather how much that investment impacts the mission itself. That, then, is the bridge that connects overhead and mission costs.
A simple way to think of ROM is in this formula:
ROM = ROI Measurement / Proportionate Mission Cost
Many food banks know how much it costs to deliver X number of meals per day, week, month, or year. But why not go a step further and consider investments in the systems that provide support for the mission? Can a new financial management solution help drive better efficiencies in meal delivery?
Surely a general ledger isn’t making meals, but it is driving the supply chain that brings in the items that become the meals, paying the expenses for those who work to prepare the meals, and keeping the lights on in the kitchen and dining hall to serve the meals.
For example, if an ROI on a new financials system can create $5,000 per year in savings, then as an organization, you can attribute a portion of that cost to mission delivery enhancements. Divide that ROI by your meal delivery statistic, and you have a ROM for that new solution that is attached to mission delivery.
This line of thinking will have you reconsider what you see as direct programmatic delivery. Is an expense management or purchasing solution part of mission delivery? Absolutely, if the mission can’t provide optimal program delivery without it.
As you consider your next project, you, your internal project team, and your potential vendors all need to ask, “What’s the Return on Mission for this project?” If a positive ROM can be established, then you have a project worth pushing forward. With ROM we are measuring our mission’s work not by the outdated metrics of overhead/program or by for-profit business standards, but by the success of the mission delivery itself.